
Anatomy of a drawdown

A long way down. From a long way up
Twenty-one years of dips, drops and recoveries
Markets have endured a difficult few weeks and Allegro has not been immune. This month, we are doing something a little different by showing every setback the strategy has experienced, what followed each one and where we stand today. Allegro’s back-tested history stretches back to July 2005.
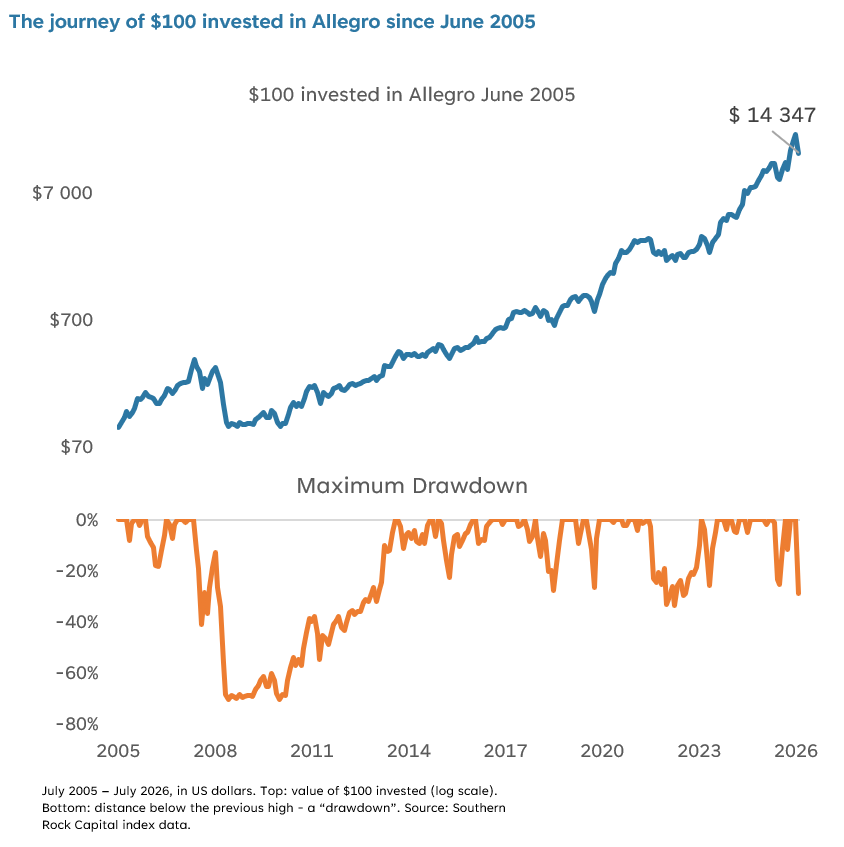
The top-right chart shows that a hypothetical $100 investment in July 2005 would be worth approximately $14,347 today. While this is an impressive result, it says little about the journey along the way.
The bottom-right chart tells the more honest story. It shows how far the strategy fell below its previous high during every month of the past 21 years. It is not always comfortable viewing, but it is an important part of understanding the strategy.
The orange line captures a simple truth about long-term investing. Growth and setbacks are not separate stories. They are part of the same journey.
The price of admission
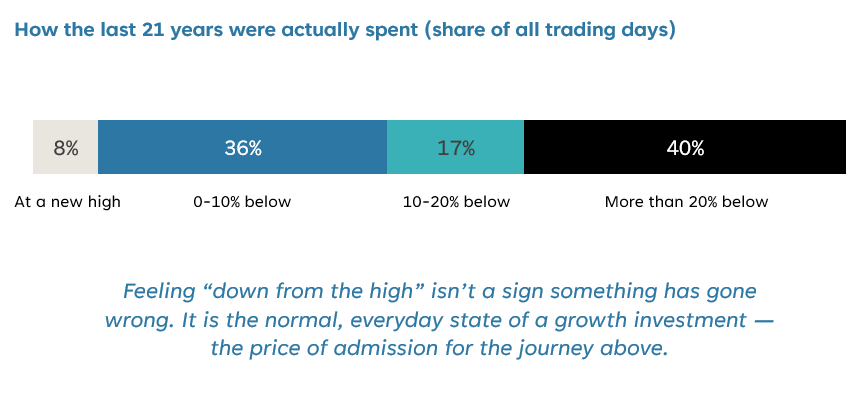
Over the past 21 years, Allegro traded below a previous high on 92% of all trading days. It spent more than half of that time at least 10% below its previous peak, while on roughly two out of every five days it was more than 20% below.
That may sound surprising given the strong long-term return, but it highlights an important point. A successful investment does not spend most of its time moving steadily higher. New highs are often followed by long periods of recovery, sharp setbacks and uncomfortable stretches where progress feels slow. The long-term reward came from remaining invested through these periods, not from avoiding them altogether.
Every setback, side by side
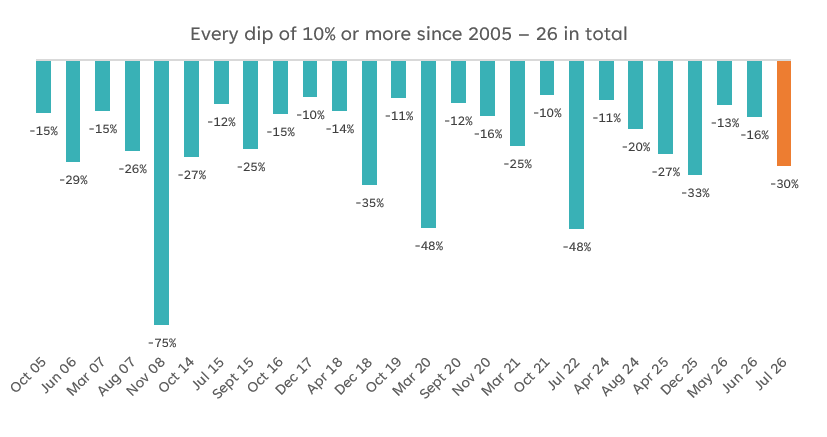
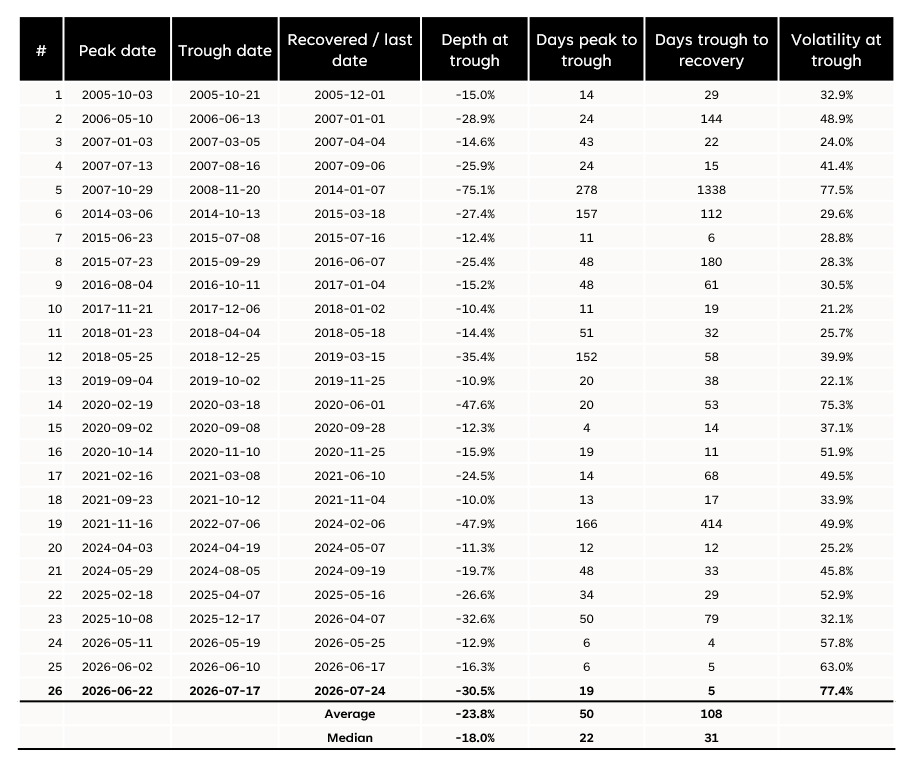
Since 2005, Allegro has experienced 26 separate declines of 10% or more from a previous high. That works out to more than one meaningful setback a year. Some were far more severe. During the 2008 financial crisis, the strategy fell by around 75%, while both the Covid shock in 2020 and the 2022 bear market saw it lose roughly half its value from its previous peak.
These periods were painful, but they are also part of what investors must be prepared for when following a high-growth strategy. Allegro’s long-term return was achieved despite these declines, not because they were somehow avoided.
Twenty-five of the twenty-six recovered fully.
Recoveries have not always been quick. Most setbacks took anywhere from a few weeks to several months to recover. The decline during the 2008 financial crisis took around 5 years from its lowest point to reach a new high, while the recovery following the 2018 decline took more than a year. So far, however, every completed setback has eventually ended in the same place, at a new high.
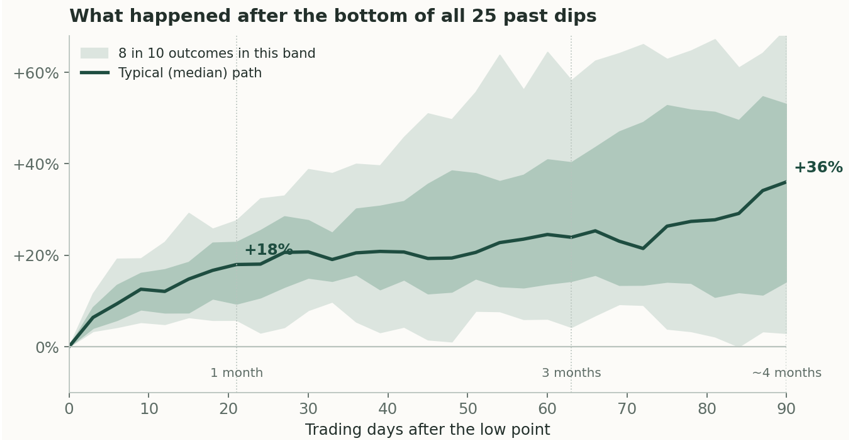
This is perhaps the most important chart to remember. We took all 25 completed declines, aligned them at their lowest point and tracked how the strategy performed over the following four months.
One month after reaching the bottom, the typical recovery was already around 18%. After three months, it had reached approximately 24%. Historically, the strongest gains often occurred during the first few days and weeks of a recovery. Unfortunately, this is also when uncertainty is at its highest and investors are most tempted to step aside.
The challenge is that nobody knows where the bottom is until it has passed. This chart simply shows what previous recoveries looked like. It does not tell us whether the current recovery has started, nor does it promise that the next one will follow the same path.
Where are we now
July 2026 – down 29%, after more than doubling
Allegro is currently around 29% below the record high it reached on 22 June. The strategy reached its lowest point on 17 July, when it was down roughly 30%, and has recovered slightly since then.
It is important to put this decline into perspective. Between the beginning of January and 22 June, Allegro more than doubled in value. The recent fall has therefore given back part of this year’s exceptional gain, rather than wiping out the gains made over previous years. Even after the decline, the strategy remains up approximately 59% in 2026 and 35% over the past 12 months.
That does not make the experience any easier for someone who invested close to the June high. Those investors are currently down almost a third, which is understandably uncomfortable. Long-term averages provide useful context, but they do not make an individual loss feel any smaller.
A decline of this size is not unusual for Allegro. Five of the 25 completed setbacks fell by at least this much, which works out to roughly one every four years. The typical recovery took around four months from the lowest point, although the time needed varied considerably.
We only need to look back a few months for the most recent example. Allegro fell by 33% between October and December 2025, before recovering and reaching a new high in early April 2026. That recovery took just under four months from the bottom.
History also shows why we should be careful about setting expectations. The 35% decline in 2018 was recovered in less than three months, while the Covid decline took about ten weeks. In contrast, the 2022 bear market took around 20 months to recover, while the 75% fall during the financial crisis took more than five years to regain its previous high.
The current setback has been sharp and sudden, taking only 19 trading days to move from its peak to its lowest point. Historically, these faster declines have recovered more quickly than slow, drawn-out falls. The typical fast decline recovered in around three weeks, compared with roughly three months for slower declines. This is useful context, but it does not guarantee that the current recovery will follow the same pattern.
Markets have been exceptionally unsettled. Daily movements over the past month have been larger than those experienced on approximately 98% of trading days during the past two decades. The strategy’s core investment philosophy and disciplined process remain firmly in place. However, the approach is not static. We continue to test new research and evidence and will refine the process where an improvement fits the strategy’s objectives. This balance between discipline and adaptability has helped guide the strategy through very different market environments.
So, what should investors do? For most investors with a genuinely long-term time horizon, the evidence points towards patience. If your financial goals, investment period or ability to tolerate a decline of this size have changed, then it is worth speaking to us or your adviser. A difficult few weeks in the market, on its own, is not a reason to abandon a long-term plan.
Related Posts



Disclaimer
Any reference to regions/ countries/ sectors/ stocks/ securities is for illustrative purposes only and not a recommendation to buy or sell any financial instruments or adopt a specific investment strategy. The views and opinions contained herein are those of the individuals to whom they are attributed and may not necessarily represent views expressed or reflected in other Southern Rock Capital Limited communications, strategies or funds. The information and opinions contained in this document are provided in good faith and are based on sources believed to be reliable. However, Southern Rock Capital Limited does not provide any guarantee regarding the accuracy or completeness of the information or opinions expressed herein. Southern Rock Capital Limited will not be held liable for any claims, damages, losses, or expenses incurred directly or indirectly by investors or their financial advisors as a result of reliance on the information contained in this document. It is important to note that Southern Rock Capital Limited does not serve as the investor's financial advisor and has not conducted a financial needs analysis. Therefore, investors and financial advisors should carefully evaluate whether the information provided in this document is appropriate for the investor's objectives, financial situation, and specific needs. Any guidance offered may have limitations in terms of suitability. Investors should be aware that no assurances of investment performance or capital protection can be inferred from the information provided in this document. It is advisable for investors to exercise caution and conduct their own research before making any investment decisions.
Southern Rock Capital Limited is authorised and regulated by the Mauritius Financial Services Commission.
